

By: Mark McCrindle
Curious about how wealth and income are distributed across the different generations in Australia?
In this updated version of the Wealth and Income infographic, using data from the Australian Bureau of Statistics we break down Australia’s income and wealth distribution and look at how it compares across the generations.
This infographic features key stats and visuals demonstrating the average household income and net worth in Australia as well as how wealth and income are divided among the population.
Australia’s Income and Wealth Distribution by Generation
The average full-time annual earnings is $97,510 with household gross annual income at $121,108.
Generation Y households make up 15% of the population and own 5% of the share of the national wealth with an average household net worth of $353,800.
Boomers are the best off financially, having around double the share in national wealth compared to their population size.
Interestingly both the Older Boomers (age 65-74) and Builders (age 75+) have an average income below the national average, but both have a net worth above the national average. Showing the effects of wealth accumulation while income tapers off into retirement.
The Gap Between Rich and Poor
The average earnings of the top 20% are 12x the average earnings of the bottom 20% and the wealth of the average household in the top 20% is 93x the average wealth of those in the bottom 20%.
The average household gross income is $121,108, however the top 20% of households earn 48% of all income. With the bottom 20% who are left with 4% of Australia’s income.
With higher wealth and income levels than ever, are we any better off?
“For most Australians, income is the most important resource they have to meet their living costs. However, reserves of wealth can be drawn upon to maintain living standards in periods of reduced income or substantial unexpected expenses. Considering income and wealth together helps to better understand the economic wellbeing or vulnerability of households.” – Australian Bureau of Staistics
Are We Better or Worse off Than Our Parents?
From 1981 to 2021, the average full-time total earnings for Australian adults increased 5.9 times, from $15,800 (1981) to $93,500 (November 2021). Today the average adult full time wage is $97,510 with median house prices across Australia at $1,008,988 or 10.3 times the average earnings. It is no wonder millennials are living at home longer and studying longer. 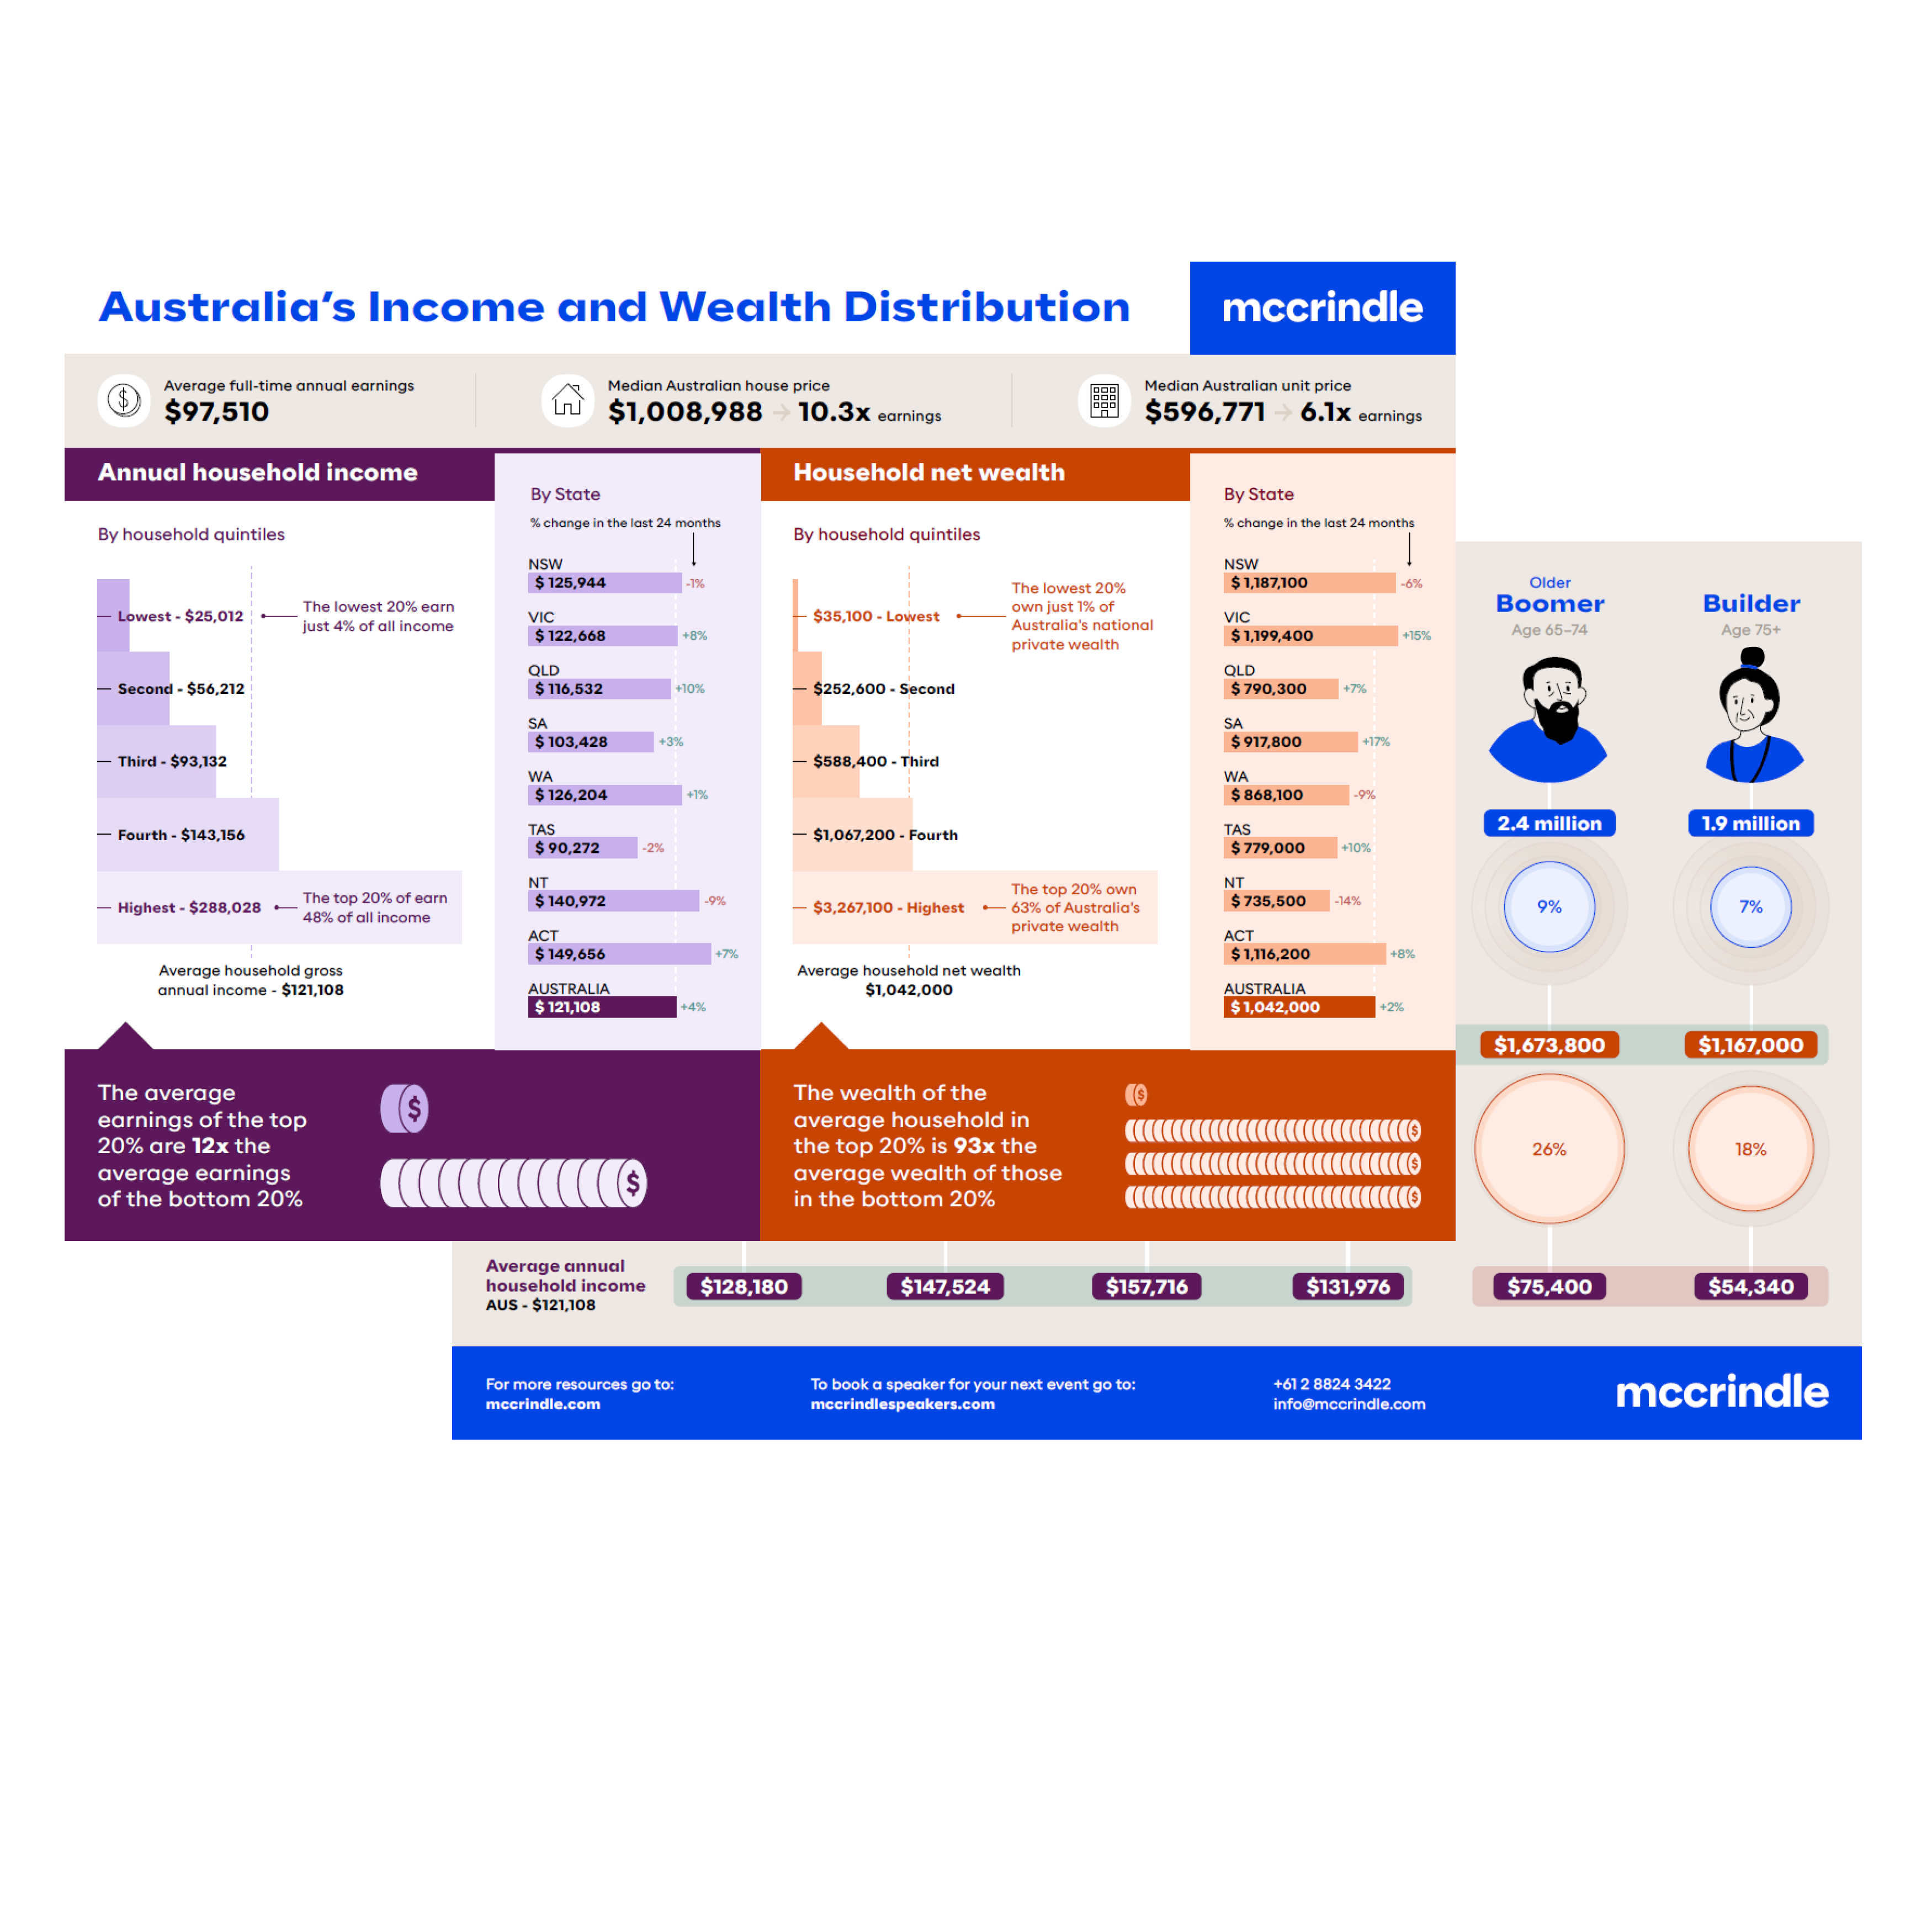
Wealth and Income infographic
Curious about how wealth and income are distributed across different generations in Australia? This infographic provides a detailed look at the annual income and household wealth of Builders, Baby Boomers, Generation X, Millennials, and Generation Z.
Article supplied with thanks to McCrindle.
About the Author: McCrindle are a team of researchers and communications specialists who discover insights, and tell the story of Australians – what we do, and who we are.
Feature image: Photo by Miles Burke on Unsplash